Coursera - Computer Science: Programming With A Purpose
Week 10: Programming Languages - Bar Chart Racer
Write a program to produce animated bar charts, using BarChart.java to draw static bar charts. As a canonical example, consider an animated bar chart of the 10 most populous cities in the world, from 1500 to 2018. To produce the visualization, you will successively draw 519 individual bar charts (one per year of data), with a short pause between each drawing. Each bar chart contains the 10 most populous cities in that year, arranged in descending order of population.
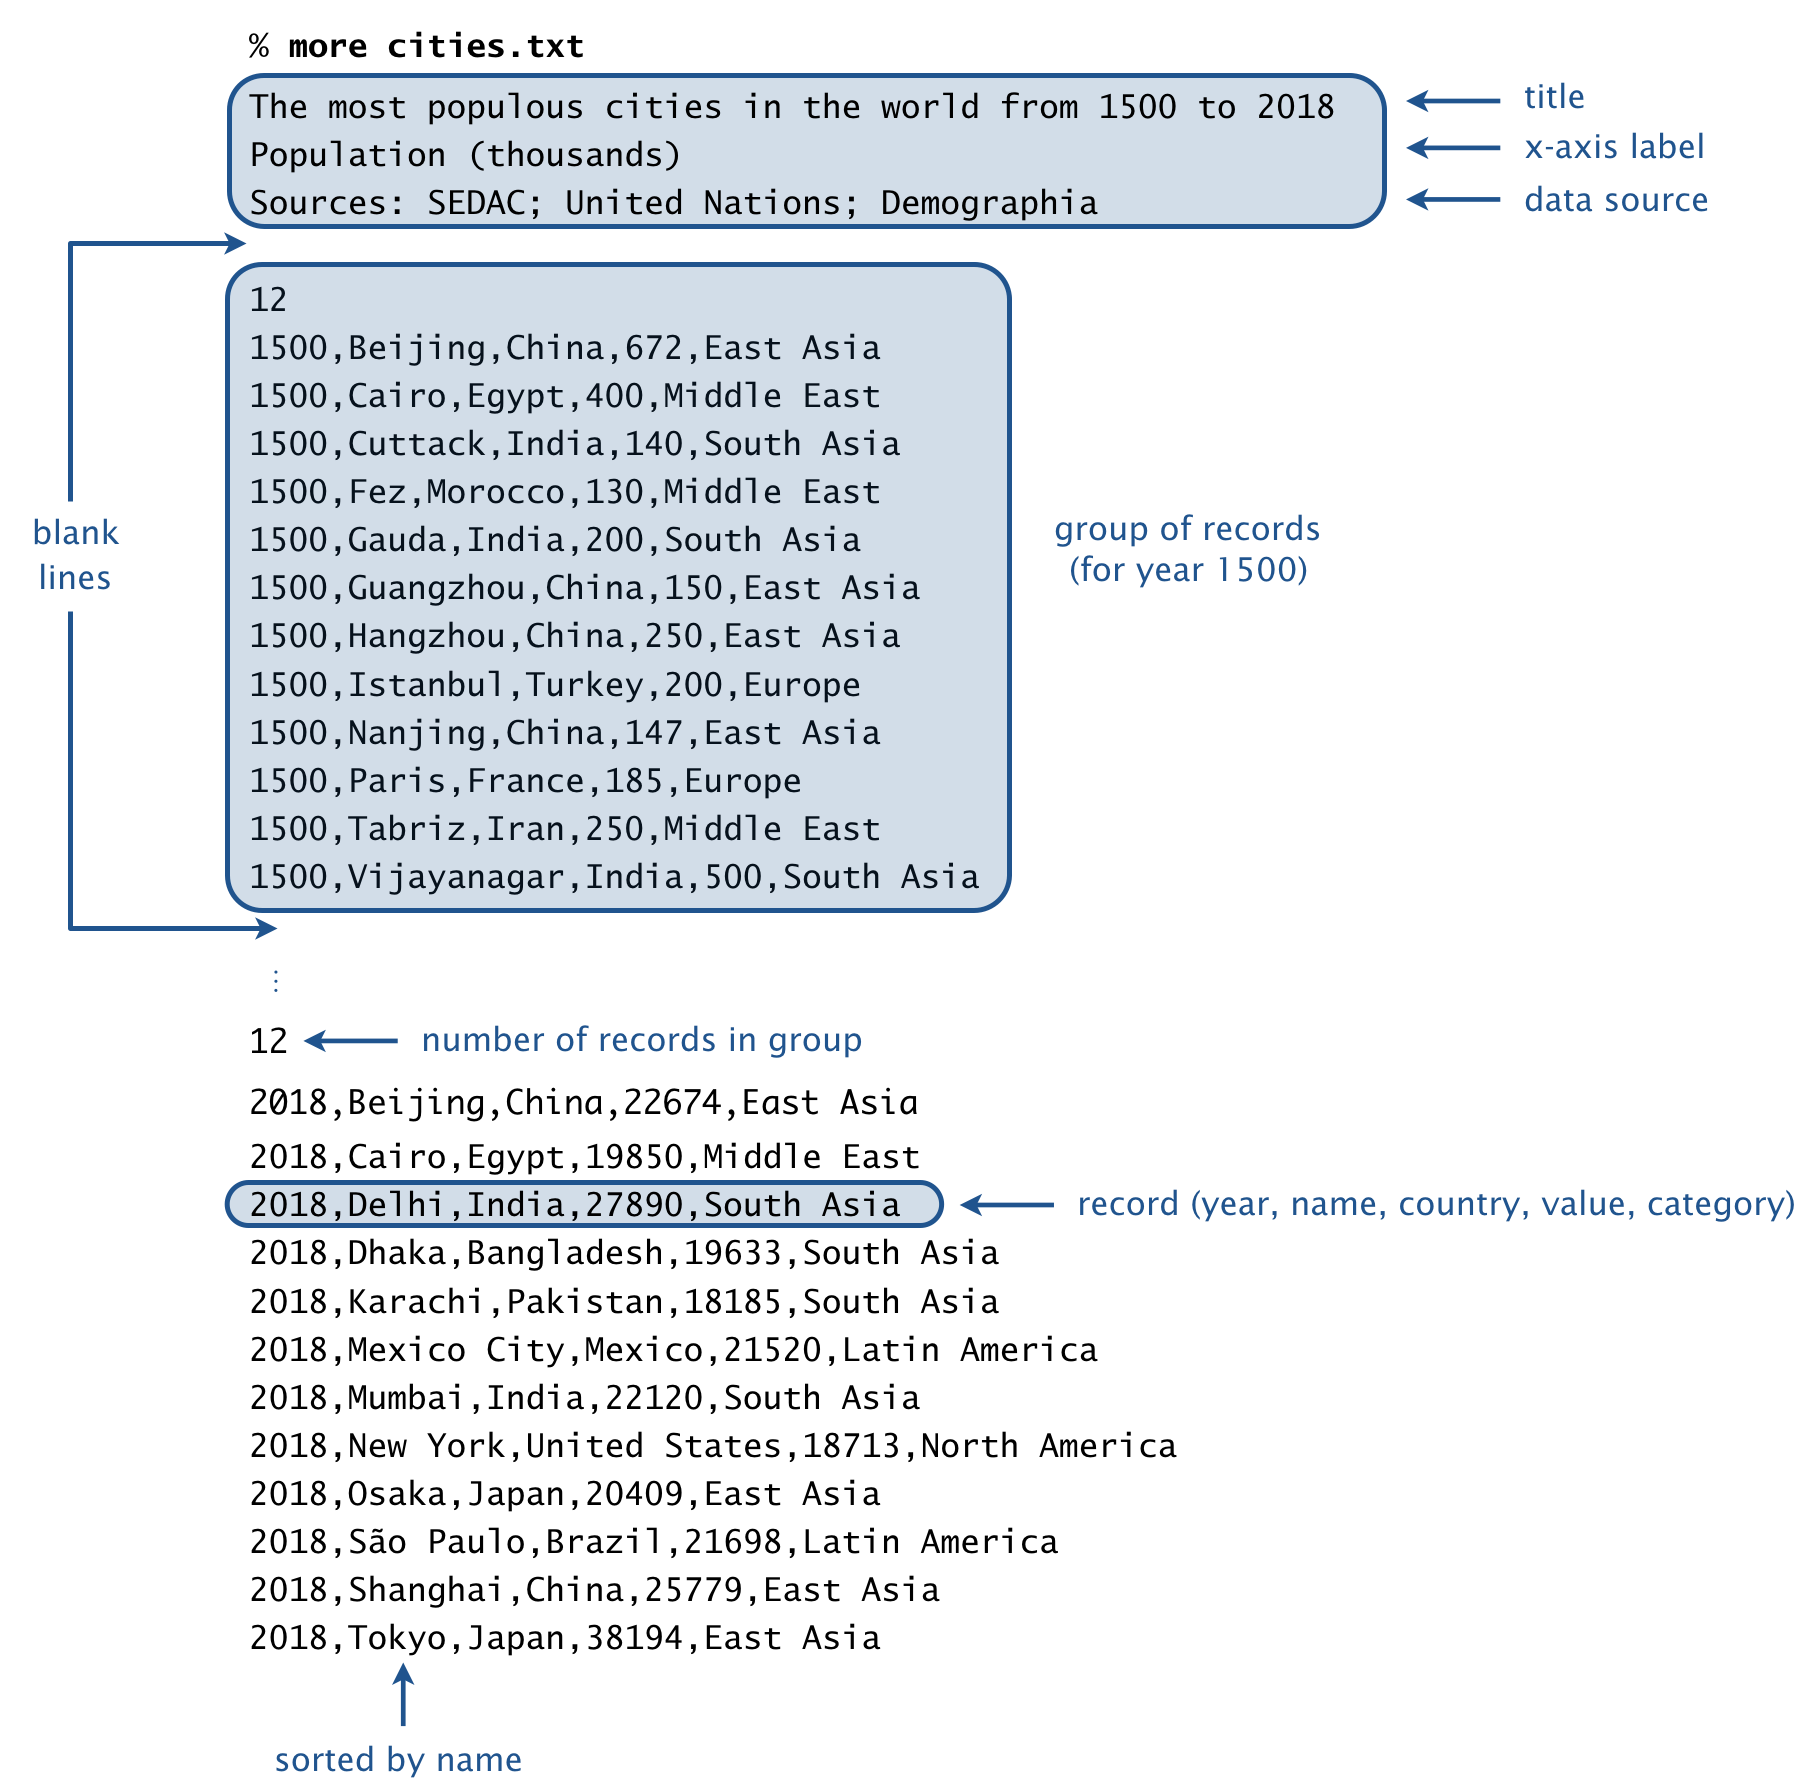
File format. A bar-chart-racer data file is organized as a sequence of lines. The first three lines comprise the header:
- The title.
- The x-axis label.
- The source of the data.
Following the header is a blank line, followed by the raw data. Each line (or record) consists of 5 fields, separated by commas:
- The year or date (e.g, 2018).
- The name (e.g., Mumbai).
- The associated country (e.g., India).
- The value (e.g, 22120).
- The category (e.g., South Asia).
The value field is an integer; the other fields can be arbitrary strings (except that they can’t contain commas or newlines).
Records corresponding to the same year (or time period) are grouped together. A group of records consists of an integer n, followed by n records. Within a group, the records are sorted by name. A blank line separates each group.
Data files. We supply a number of fascinating data files in the specified format, curated from various sources.
| input file | description | period | data source |
|---|---|---|---|
| cities.txt | most populous cities in the world | 1500–2018 | John Burn-Murdoch |
| countries.txt | most populous countries in the world | 1950–2100 | United Nations |
| cities-usa.txt | most populous cities in the U.S. | 1790-2018 | U.S. Census Bureau |
| brands.txt | most valuable brands in the world | 2000–2018 | Interbrand |
| movies.txt | highest-grossing movies in the U.S. | 1982–2019 | Box Office Mojo |
| baby-names.txt | most popular baby names in the U.S. | 1880–2018 | U.S. Social Security |
| football.txt | the best football clubs in Europe | 1960–2019 | clubelo.com |
| endgame.txt | characters in Endgame by screen time | Minute 1–170 | Prashant |
| infinity-war.txt | characters in Infinity War by screen time | Minute 1–132 | Prashant |
| trademarks.txt | trademarks granted by country | 1980–2018 | WIPO |
| patents.txt | patents granted by country | 1980–2018 | WIPO |
Soundtrack (optional). If you would like a musical accompaniment to your animated bar chart, add the following line at the beginning of your program:
StdAudio.loop("soundtrackA.wav");
Feel free to substitute a different .wav file.
Command-line arguments. The program takes two command-line arguments: the name of a bar-chart-racer file and an integer k that specifies how many bars to display in each bar chart. Here are some sample executions:
~/Desktop/barchart> java BarChartRacer cities.txt 10
Link To: cities output
~/Desktop/barchart> java BarChartRacer brands.txt 15
Link To: brands output
~/Desktop/barchart> java BarChartRacer movies.txt 10
Link To: movies output
~/Desktop/barchart> java BarChartRacer endgame.txt 10
Link To: endgame output
Note: the above description is copied from Coursera and converted to markdown for convenience
Solution:
public class BarChartRacer {

    private static void readGroup(In file, int k, BarChart chart) {
        final int n = Integer.parseInt(file.readLine());
        final Bar[] bars = new Bar[n];
        for (int i = 0; i < n; i++) {
            final String line = file.readLine();
            final String[] tokens = line.split(",");
            final String year = tokens[0];
            final String name = tokens[1];
            // final String country = tokens[2];
            final int value = Integer.parseInt(tokens[3]);
            final String category = tokens[4];
            bars[i] = new Bar(name, value, category);
            chart.setCaption(year);
        }
        Arrays.sort(bars);
        int count = 0;
        for (int i = bars.length - 1; (i >= 0) && (count < k); i--) {
            final Bar bar = bars[i];
            chart.add(bar.getName(), bar.getValue(), bar.getCategory());
            count++;
        }
    }

    public static void main(String[] args) {
        final int k = Integer.parseInt(args[1]);
        final In file = new In(args[0]);
        final String title = file.readLine();
        final String xAxisLabel = file.readLine();
        final String dataSource = file.readLine();
        // StdAudio.loop("soundtrackA.wav");
        StdDraw.setCanvasSize(1000, 700);
        StdDraw.enableDoubleBuffering();
        BarChart chart = new BarChart(title, xAxisLabel, dataSource);
        while (file.hasNextLine()) {
            chart.reset();
            StdDraw.clear();
            file.readLine();
            readGroup(file, k, chart);
            chart.draw();
            StdDraw.show();
            StdDraw.pause(100);
        }
        file.close();
        // StdAudio.close();
    }
}
Link To: Java Source Code